TRADING CARDS ARE COOL AGAIN
Josh Luber
4 November 2021
TABLE OF CONTENTS
Forward
Introduction: Some History
Trading Cards in the 1960s and 1990s
What’s Next?
Part I: Recent Growth and Volatility
The Card Ladder 50 Index and what it tells us about the market
From COVID to $738K Jordan rookie sales
Part II: The Q2 Crash and Theories of Correction
General Theory: Low-Cost-Bases and One-Less-Buyer Dynamics
Special Theory: Card Shows, Crypto and Closed Grading
Indications of Market Health: A 2021 Timeline
Part III: What Inning Are We In Now? Prices, People and Companies
Part IV: Risk Factors, Warning Signs and How to Think About the Future
The Paradox of Supply
Inflation Risks
Lessons from the Sneaker Market
Part V: Sneakers, Cards and The Future
Appendix
Bibliography
FORWARD
I have a room in my house where I keep my cards. And I have a lot of cards. It’s a small windowless room, with a locked door. There are a few safes, but most of the slabs are in black PSA boxes, or stacked on shelves. And the reason I tell you this is because of the smell. Man, the smell! It’s the smell of plastic, of PSA and BGS and SGC slabs, of top loaders and penny sleeves and semi-rigids, and I’m sure to most people it’s probably not a very nice smell. But to me it’s the smell of cards, of value, of excitement. It’s actually refreshing, invigorating. Every time I walk into the room, it hits me, and I get a jolt of energy. It’s the same smell at my friends’ houses who have cards and I love walking into their card rooms, too.
I really like the smell, is all I’m saying.
I really like cards.
And I also like writing.
1. With extraordinary assistance from Lucius Best, Niket Hans and Anh Pham. Thank you all for your time and effort, data and wit, charts and prose, and early early morning writing sessions. This was an absolute blast
The opinions herein are my own, and only my own. The jokes are mine, too, although I don’t stand by them quite as strongly as my opinions. And the facts are, well, facts.
Enjoy.
-Josh
***
INTRODUCTION: SOME HISTORY
The trading card market has a history of upheaval.
1960s
2. The Berger story is recounted in numerous books on the hobby, including Pete Williams’ Card Sharks (pg. 47)
1990s
3. See Dave Jamieson’s book, Mint Condition (pg. 177)
With every generation you get stories like these - hundreds of thousands of cards become so useless that they are physically destroyed. These tales, in addition to being fun bits of history, paint a vivid picture of historical disequilibrium.
Sometimes the crisis originates on the demand side: a “people” crisis. And sometimes it originates on the supply side: a “company” crisis. But in each case, the result is the same: supply > demand. Either the companies are making too much product, or there aren’t enough people to buy it.
4. In the early 1960s a survey found that 89% of boys collected baseball cards (Mint Condition, pg. 102)
5. Card Sharks (pg. 137)
6. According to one estimate, the number of card shows held in 1987-1988 accounted for half of all card shows held since 1973. See House of Cards (pg. 22)
7. House of Cards (pg. 16)
8. Mint Condition (pg. 156)
9. For me it was Sportscard Corner on Montgomery Avenue in Narberth, PA. That place smelled like 1991 Stadium Club baseball cards
10. Topps, then a publicly-traded company, had a stock price of over $20 in the 1980s, which fell to $4.25 by 1996 (Mint Condition, pg. 184), Meanwhile, baseball card revenue fell from an estimated $1.5B in 1991 to $400M by the end of the 1990s, and down to as low as $200M in 2008
11. Mint Condition (pg. 8); House of Cards (pg. 16)
12. For all you 25 years olds laughing, just wait. I’m 43 and caught myself making a sound that could very well be described as ‘wheezing’ literally today
13. Mint Condition (pg. 187)
What happened in the 1990s shows the difference between a market price correction and a full-blown crisis. Markets correct all the time. Sometimes they go down a little. Sometimes they go down a lot. But a market crisis, like we saw in the 1990s - that’s something totally different. In a crisis, the entire system breaks down, whether it's the US housing market in 2008 or the Russian Revolution in 1917 or the trading card market in 1994. For trading cards, it took an entire generation to build that system back up, and only in the past few years has it started to feel like cards might finally become a mainstream cultural institution again.
People are excited about cards again, but at the same time people are looking around for signs of another crisis. After all, they tend to happen every few decades - hey, maybe we’re due. In Q2 of this year we saw a massive drop in card values and if you focus closely on that, you might have reasonable cause for concern. After all, for people who entered the hobby within the past year, many have seen a lot of value go up in smoke. Sure, no one is burning cards; no one is tossing them into a woodchipper; no one is barge-dumping them into the ocean - but if you bought into the hobby at the beginning of the year, it might feel like your cards have been partially destroyed - at least compared to your cost basis.
14. Asked Jed
Are cards here to stay or is this the beginning of the end?
Are we at the beginning of an epic bull market like circa 1984? Or are we nearing the very end, like 1994, when Papa Joe Chevalier shredded half a million worthless cards?
It has been a fantastic ride the past four years as my generation has rediscovered cards. We’ve dug through our parents’ basements for worthless junk wax binders; we realized we could afford that Michael Jordan rookie we couldn’t as a kid; we shared opening packs with our children like our parents did with us; and we learned that cards are true investable assets. Trading cards are cool again and now we’re the generation who decides what’s cool, who make decisions for multinational corporations, who start tech companies with investor money. Cards are becoming a mainstream cultural institution again, presumably for good this time.
Or is it?
Does the Q2 crash signal something different? Are there other, less obvious systematic fault lines running beneath the surface? Are we blinded by our own nostalgia?
I want to argue the former: Cards are here to stay. For reasons I’m about to explain in detail, I believe we’re much, much closer to 1984. But it’s also clear that we are standing on the precipice of a different path, one we must avoid. We’ve all been internalizing the extreme changes of the past few years in our own way. Now is the perfect time to take a deep breath, then take a deep dive into the industry. Let’s use this moment to acknowledge and catalog what has happened so far, learn what we can, and move forward with new insight.
***
15. I once met two guys from Norway who had just met each other and both of their names were Bjorn Bjornson
***
If the defining feature of any card market crisis is an imbalance of supply overwhelming demand - whether driven by the absence of “people”, or the intemperance of “companies” - all the available evidence we have right now points in the exact opposite direction. Hobby shops can’t get enough product; everything that Topps and Panini release sells out within days (or even minutes); on eBay and Goldin, buyers outnumber sellers; and every other day there’s a new, record-breaking multi-million dollar sale making headlines. If you put 101 economists in a room, had them pour over the data and then summarize the market in one pithy, simple equation:
Demand >>>>>>>>>> Supply
….would be what’s written on the chalkboard. Break out your Vote Mondale stickers and turn up Purple Rain, it’s time to party like it’s 1984.
16. “Your future hasn't been written yet. No one's has. Your future is whatever you make it, so make it a good one" -Dr. Emmett Brown
If you look at recent trends some troubling indicators emerge. Industry stalwart Geoff Wilson of Sports Card Investor warns that manufacturers appear to be falling into dangerous overproduction strategies in his podcast decrying the expansive devolution of Select (more on this below). Yes, the fundamentals of the market have never been stronger: new people, new investments, new innovations abound - but if people start acting like it’s 1994, we could kill the bull before it even has a chance to run.
17. Introducing the narrative structure of this paper on this page is akin to The Departed running its opening credits 18 minutes into the movie. I guess that makes me Martin Scorsese and this footnote is Mark Wahlberg’s Boston accent
Part I reviews the growth and volatility of the market over the past 18 months, with particular focus on the runup to the Q2 2021 crash
Part II situates that Q2 crash in terms of broader signs of market health and proposes several non-crisis explanations for the correction
Part III takes a longer and forward-looking view as to ‘what inning we are in’ by analyzing the three sections of the market - Prices, People, and Companies - separately
Part IV is a deep dive into the risk factors of growth, with particular attention on the paradox of supply and risk of inflation
Part V makes a full comparison between sneakers and trading cards and leaves us with tempered optimism that cards can reach (or perhaps even surpass) the exponential growth the sneaker industry has seen over the past ten years
Part I: Recent Growth and Volatility
18. Card Ladder is one of the leading data and analytics companies in the trading card space and uses eBay sales as their primary data source. As described on their website: “The cards, players and categories of the CL50 were hand-selected by the Card Ladder team based on their cultural and historical influence on sports and the sports card hobby.” The CL50 is not a perfect index, but it is directionally correct and for illustrative purposes is the best index we have for the sports card market. See APPENDIX 1 for a list of the 50 cards in the CL50
CARD LADDER CL50 INDEX - JAN. 2019 - SEPT. 2021

19. This is pretty good evidence that these events were at least partly responsible for the trading card industry explosion but I think most people (and the media) drastically overstate its actual impact. Cards were going to blow up in 2020 anyway; COVID and The Last Dance just added fuel to the fire
20. Assuming, of course, that you don’t know what a ‘Crypto Punk’ is
How does that happen? How does an entire market nearly triple in the course of a few months, especially after rising so much the previous year? That was the crazy thing about the Q1 2021 runup - it happened off a much, much higher base than any previous boom. It’s one thing to go from $5,000 to $14,000. It’s quite another thing to go from $12,000 to $33,000.
What happened?
At the highest level, the story goes something like this:
For the past several years the market followed a very clear pattern of mini-booms and partial corrections. Prices would rise quickly, then fall slightly, then rise again, each time surpassing the previous high. Buried within the CL50 chart above are hundreds (maybe thousands, actually) of these:
To restate the most important characteristic of this boom/bust growth: with each new boom the market very quickly surpasses the previous high.
As the Hobby itself continued to grow and attract new collectors - often with big money focused on big money cards - each subsequent runup was bigger than the last. Each time, the same fundamental dynamics repeated themselves: prices would rise, everyone would get excited, FOMO would kick in and bidding would go crazy, causing prices to surge even higher. Economists call it ‘irrational exuberance’. Reddit calls it ‘Stonks’. Maybe it’s something about the smell of cards.
Whatever you call it, that was the dynamic, every single time.
And every time, the booms got bigger.
Until we hit the big one.
The big Q1 2021 boom came in riding the most notable big-money card there is: the 1986 Fleer Michael Jordan rookie card in perfect condition. On January 30th, two PSA 10 MJ rookies sold for a record $738,000 each - quite a noticeable jump from three months prior when it was only $120K. And it was only $40K a year prior.
21. The only venture round packed with more big-time names was a certain Detroit-based sneaker marketplace back in December of 2016 (thanks Em!)
That’s a LOT of people with a LOT of money all being introduced to cards at the same time, particularly when you consider that Goldin probably pitched 4x as many other big names as those who eventually invested.
What if some of those guys decided to go after a Jordan?
22. This is an entirely fictional conversation that I created to make a point (and joke). Any resemblance to any real conversation that actually happened is purely coincidental
Mark Cuban: Hey Ken, thanks so much for letting me invest; this baseball card industry sure seems swell. I wanna buy some cards myself. What’s the one card I absolutely HAVE to have?
Ken Goldin: The 86 Fleer Jordan PSA 10 of course. Just so happens we have several of those coming up for auction soon.
Cuban: Well, I guess if there are no Maxi Kleber rookies in the auction I’ll consider the GOAT. How much is that worth?
KG: $100K now but, in my opinion, it’s a million dollar card one day. Many other people think so, as well.
INT. We cut to Cuban’s phone. He opens a text thread with Mark Wahlberg. Our protagonist begins typing...
Cuban: Hey Wahlberg! Haven’t seen you at the Monthly Meeting of Marvelous Marks recently. Quick question for you - what’s your take on the Jordan 10?
Wahlberg: Yeah, sorry I hate missing the M4 but I’ve been taking a potato-cooking class at the same time. But the Jordan 10? Shoe or card?
Cuban: Card.
Wahlberg: Most iconic card ever.
Cuban: You think it could go to a million?
Wahlberg: Def at some point. There are a few coming up in the Goldin Auction. I am going to buy one now while it’s still cheap.
Cuban: Right on. How much are you going to bid?
Wahlberg: I’m going to bid $800K. If I get it cheaper, great, but I’d rather make sure I get it. Even at $800K it’ll be a good deal eventually.
Cuban: Right on. There are two. I’ll bid $800K on Lot X. You bid $800K on Lot Y.
Wahlberg: Right on.
Cuban: Right on.
Wahlberg: Right on.
Cuban: Hang up.
Wahlberg: You hang up.
Cuban: No you hang up.
Wahlberg: This is a text thread.
Cuban: Right on.
Cut to Dick Costolo and Rich Kleiman, sitting next to each other, peeling potatoes, having just called in sick to the D4, having the same conversation...
23. Again, this conversation is 1000% fictional. I do not know if Mark Wahlberg or Mark Cuban have ever spoken to each other. I do not know whether they have ever bought cards at Goldin Auctions. I do not know who bought or bid on the Jordan 10s that sold for $738K. I have no knowledge that any of the investors in the Goldin round have ever bought or bid on any cards, either on Goldin Auctions or elsewhere. I have no knowledge that anyone had any conversations with Ken or anyone else about cards or potatoes. And yet someone will still troll me on IG for this smh
You get the point.
That is how easy a runup can happen.
Will the Jordan 10 be a million dollar card one day? Yes, I personally believe that it will. But it was a $100K card a year ago. Expecting it will go to a million is perfectly reasonable, but expecting it to go to a million in a year - as some people may have - is probably a bit foolhardy. And so you can see the completely logical contradiction: it’s perfectly rational for one person with deep pockets (or even four, as it were) to pay $738K for the Jordan 10 today, but that doesn’t mean that the rest of the market will.
24. OMG Mark, please forgive me!
25. As opposed to being at now, now, courtesy of Colonel Sandurz and Dark Helmut
***
That tangent on how card prices hit new highs was a bit long (but clearly worth it for the Mark y Mark joke) so allow me to break the 4th wall and remind you that we were still attempting to dissect the nearly 200% runup of the CL50 that began in late 2020 and peaked in Q1 2021.
***
26. Because of COVID, the NBA Draft was held in November in 2020 but it’s usually held in June
This jives with normalcy as it seems like the card market turns up in October/November every year; the NFL is in full swing, baseball playoffs are underway and the NBA is knocking on the door! In 2020, the regular league schedules had been set ablaze due to COVID and so the NBA Draft was the key moment. It kicked off speculation about players which kicked off speculation about their cards. More excitement, more FOMO, more disposable income from more buyers - before you knew it, prices were back on their way to the moon.
We can literally chart this.

The boom cycle starts on the day of the NBA Draft and peaks the week of another intervening event, the third stimulus check, when billions in government dough poured fuel onto an already-raging fire.
And then, just like every other time before, something changed in our mass psychology. And prices started to fall. For the next ten weeks, pretty much every auction ended lower than the last, and it felt like the market was in freefall. By the end, prices were down ~50% from their peak: a massive, brutal, confidence-shaking crash.
We are now several months removed from the nadir and it appears the market has stabilized, and many of those deeper fears have been assuaged (if not extinguished). Indeed, the CL50 shows a modest uptick over the past three months. Even after the Q2 correction, prices are substantially higher than they were before the runup, and the CL50 is roughly 50% higher than it was on January 1st - which is obviously pretty great compared to stock market indices and traditional investments - but we need to point out where we are in this specific boom-bust cycle:

We haven’t fully gone back into the next boom cycle yet and we have definitely haven’t turned back up past the previous high. The ‘modest uptick over the past three months’ has been just that - modest. Maybe the ‘Oct/Nov fervor’ we’re feeling with the NBA back will fully plant us back into a boom - in which case we could exceed the Q1 peak relatively quickly. Or maybe we’ll just continue with this slow and gradual climb, in which case it might take years before we regain the Q1 highs. Or maybe we’ll see more of a bifurcation of cards, with the super scarce cards coming back more quickly, and those iconic, but more highly liquid, cards, staying at these ‘new lows’.
Here are Card Ladder charts for two such cards; iconic, all-time cards with relatively high pop reports where the pattern is currently similar to the larger index: Micheal Jordan 1986 Fleer #57 PSA 10 rookie (pop ~319) and LeBron James 2003 Topps Chrome #111 PSA 10 rookie (pop ~2100):

Both cards follow the same trajectory as the CL50 and the market as a whole: a massive runup that culminates in Q1 2021, a significant correction in Q2 where prices bottom out, followed by reduced volatility and a modest uptick in Q3. Again, a modest uptick in Q3.
Faced with the severity of the Q2 correction, many collectors remain concerned, and questions continue to percolate regarding our place in the larger historical trajectory. Is the recent stabilization merely a mirage - a temporary pause in an inevitable, ineluctable fall? Is this the beginning of the end, or merely the end of the beginning? Is it 1984 or 1994?
Part II: The Q2 Crash & Theories of Correction
In this section, I want to argue that the Q2 correction does not indicate a broader crisis. For reasons I explain below, the card market moves in predictable cycles of boom and bust, and Q2 was simply another instance of the cycle. If you’re only looking at 2021, the correction in Q2 looks pretty extraordinary. But if we pull back and take the historical view, the picture looks quite different.
27. A logarithmic scale is a way of displaying numerical data over a very wide range of values in a compact way. It is used to respond to skewness towards large values; i.e., cases in which one or a few points are much larger than the bulk of the data
CL50 Index: 2004-2021 (Logarithmic)

Two things stand out here:
First, up until 2020, the distinguishing feature of the card market was it’s consistent, almost-boring price stability. The 10-year period from 2004-2014 and the four-year period from 2016-2020 were both eras of remarkable consistency: a very modest climb with barely any volatility. In 2015, we saw a relatively short bull market, where prices rose faster than usual and established a new equilibrium for the four years that followed. But other than that, 2004-2020 was an era of tranquility (with notable exceptions of Malice at the Palace, Occupy Wall Street, and Trump).
The second thing that stands out is that the correction in Q2 2021 had at least two clear antecedents: a small but significant dip in Q4 2016, and a larger dip in Q3 2020. As mentioned in the previous section, there were actually thousands of mini boom-busts taking place over the years but most readers will vividly recall the 2020 runup and dip. At the time it was the most severe we had seen in decades. Of course, as the chart makes clear, the Q2 2021 boom-bust would quickly become the largest of the three but the key is that none were structurally different from the others; they all followed the same patterns of expected boom/bust . . . except . . . except for the fact that we are real-time living the next turn; we are real-time living right here:

If we eventually pull back past the Q1 high, then we can sign-off, once again, on an identical boom-bust cycle. But we might not. As some people think, it may take years before we ever glimpse the peaks we saw in Jan/Feb of this year.
28. Or perhaps an examination - an extemporized experimentation. But in this evocation, I mean no exaggeration, exploitation, or indulgent self-exhilaration. And while I now deserve excoriation for your exasperation, I hope you’ll allow my exoneration with no more explanation. Peace
29. Just so the documentation of my egotism is accurately explicit, with my general and special theories of trading card crashes I’ve now compared myself to Albert Einstein (in addition to Martin Scorsese in an earlier footnote)
First, the General Theory:
There are two fundamental dynamics that develop during any quick runup in the card market: Low cost bases and a decreasing number of high-end buyers.
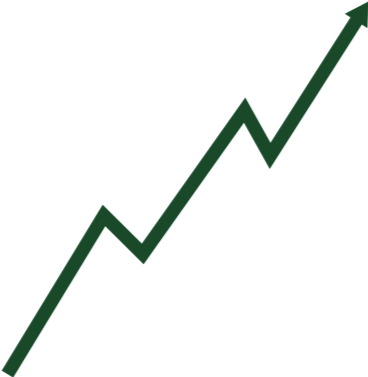
The first is about sellers, and is the most obvious: After a fast runup in prices many people will be left holding cards with low cost bases, now with huge potential windfalls on the table. Consider these four iconic cards and their prices over the past year:
Kevin Durant 2009 Topps Chrome Refractor PSA 10 rookie
Kobe Bryant 1996 Topps Chrome PSA 10 rookie
Tom Brady 2000 Bowman Chrome PSA 10 rookie
Wayne Gretzky 1979 O-Pee-Chee PSA 8 rookie
To call out the most important stat here, these cards all appreciated by more than 200% in less than five months! So what happens if it’s February 2021, you check Card Ladder and see that your cards have all tripled in the past few months? What do you do?
Wait, before you answer that, let me clarify that you bought some of those cards a year earlier, in February of 2020. So you’re actually up more than 10x on those cards.
But wait, some of those cards you actually bought a few years ago. And on those you’re up over 100x.
Now what are you going to do?
Of course you’re going to sell. At least some of them.
After each new high the market sees a flood of new sellers with low cost bases unloading their cards, as well. Ken Goldin reported that shortly after the two $738K Jordan 10 sales Goldin Auctions received forty (40!) Jordan 10s to sell over the next month. There are only 319 in existence, meaning ~13% of the population hit the market at roughly the same time!
What counterbalances this dynamic is that, for a period of time, there will be a steady stream of new buyers (new “Marks”) ready and willing to absorb this supply, and that keeps the runup booming…temporarily.
This leads us to a second fundamental dynamic of the General Theory, concerning buyers: the rarer and more expensive the card, the fewer potential buyers exist, and with each sale of such a card there is one less potential buyer for the next card.
To see how this plays out, let’s look at the Jan 30 Jordan 10 sales at Goldin. For two to sell for $738K each means there were at least four willing to pay $700K. After the auction, two of those four now own a Jordan 10. The next time one comes up for auction, there are two fewer buyers out there willing to pay $700K, and it’s already a pretty small group to begin with. There are only so many people who have the means, obsesion, and potato-free time to pay eighty stacks of high society for a trading card.
30. This exact scenario actually happened to me a few months ago when I was chasing the Tom Brady 2018 Prizm Rainbow (see APPENDIX 3 for details)
And as luck of alliteration would have it, there are three C’s that make up the Special Theory: Card Shows, Crypto and Closed Grading:
1.Card Shows Killed The eBay Star
TL; DR - Lockdowns ended, in-person card shows returned, and demand was no longer concentrated in a single online market
As discussed above, one of the most positive signs of industry health was the resumption and proliferation of card shows. I can’t speak highly enough about the experience of going to a show versus buying cards online – the energy, the community, the wheeling and dealing, the thrill of the hunt, the smell of the room; none of that can be replicated online. And card shows are the perfect vehicle for bringing new people into the Hobby, particularly the parent/child experience (as it was for me as a young boy).
Yet despite all its virtues, it’s entirely possible that the return of card shows contributed (perhaps significantly) to the Q2 card price crash. In 2020, when there were no card shows, 100% of the supply for cards was concentrated online. eBay and Goldin had an effective tag-team monopoly with super high-end cards at the auction house and everything else at the auction site. This concentrated supply caused prices to do exactly what we would expect them to do: rise. But in Q2, with lockdowns eased and supply spread out over dozens of channels - including local card shows which, IMO, are definitely the most fun place to buy - the demand on eBay and Goldin was less intense, causing prices there to drop.
31. Disclosure: I own 16 of this card. I also own 6 of the die-cut /50 version. And 1 printing plate. And….71 of the Upper Deck Prominent Cuts card plus 14 Khloe Prominent Cuts and 15 Kourtney. Hey, demand is demand!

In 2020 these three brilliant card investors all go to eBay and find one Kim K card for sale. They bid each other up and the card sells for a new record high. Fast forward a year and these three investa-geniuses, still always on the hunt for KKW Upper Decks, each take a different path on this particular day:
Kevin lives in LA and goes to his favorite local card shop, Kards & Koffee, having just reopened from a long KOVID break;
Karter lives in Philly and goes to the Valley Forge Kard Show; and
Kagney lives in the Metaverse because he’s seen Ready Player One eleven times and is way ahead of all of us
Kevin finds a Kim K at Kards & Koffee and Karter finds one at the Kard Show, so neither checks eBay that day, leaving Kagney as the only bidder for the kard online. He scoops it for a super low bid, which is immediately analyzed by Kard Ladder as legit, causing MY portfolio to drop by 35% WTF!!
You get the point.
As long as the industry continues to use eBay as the source of truth for market pricing (just walk a card show and see how many people are checking closed auctions on their phone), overall prices will fall if eBay prices fall. And scenarios like above are almost definitely playing out multiple times a day, every single day, now that all card channels are open again.
2. New Kids On The Block(chain)
TL; DR - New buyers were also exposed to crypto, and market correlation exacerbated the crash
As we explore in more detail in the ‘timeline’ below, the number of new and young participants in the Hobby is increasing. This is a good thing! But if newcomers are overrepresented on the buy-side, while old-timers with low cost bases are all on the sell-side, this can lead to volatility - especially if the new buy-side traders share a common characteristic: namely, exposure to crypto and NFTs.
Unlike the older cohort of collectors who tend to be, well, older, many newcomers to the Hobby tend to be the same kids driving the nontraditional investment boom. So at the start of 2021 a lot of young investors were watching both cards and crypto head to the moon, trying to decide where to focus their portfolio.
The following chart compares the CL50 with the price of Bitcoin for the 12 months between August 2020 and August 2021.
CL50 vs BTC Price (Aug. '20-Aug. '21)

As you can see, the two markets moved in tandem for most of the year. Between November and early March, both the CL50 and Bitcoin saw the same ~200% gain. The card market started to correct in mid-March, and Bitcoin crashed in April.
The theory of market correlation - both positive and negative - has been floating around for a while. At the start of the Q2 card crash, it was widely assumed among Hobby observers that crypto was draining money (specifically young, new-buyer money) from the card market. And after crypto saw a crash of its own, it makes sense that the negative effects would spill over (if you’re a new investor who just saw 50% of your wealth evaporate in months, it probably has a generalized effect on your psyche).
That said, I think it’s a bit too easy to intuit that the crypto market simply pulled money out of the card market - although I’m sure there are some individual examples of that. Rather, I think there is a much more complicated interplay here that is a function of individuals having money tied up in two new markets which are both falling at the same time and, if anything, that one month head start might have prompted investors to choose crypto over cards. And this dynamic likely made the Q2 card crash worse than it would have otherwise been. So while the connection is complicated and definitely not a straight line, I will concede that a connection exists - if for no other reason than I bought Bitcoin at $50K the same week I paid $90K for a Jackie Robinson 1948 Leaf PSA 6. Bitcoin fell 30%+ after that and the Jackie is now worth $45K, but Bitcoin has come all the way back to cross $60K as of the writing of this sentence (10/19/21). Moreover, Bitcoin has a clear history of far greater volatility, and that, too, could be a reason that some choose crypto over cards.
3. Public Service Announcement: PSA IS STILL CLOSED!
TL; DR - The grading shutdown reduced the amount of free cash in the market, decreased demand and undermined confidence
As previously mentioned, PSA and BGS suspended their grading services at the end of Q1, overwhelmed by the flood of new submissions. At first glance, you might think that this would boost resell prices by shutting off the firehose of graded card supply, but there was a larger effect that ran in the opposite direction. The ‘buy-grade-flip’ pipeline was effectively shut down, and this removed serious energy - and liquidity - from the card market. All card shops that ran group submission businesses (and stand-alone group subbers) immediately lost all of that revenue. For many dealers, a good portion of their bankroll has historically come from the buy-grade-flip strategy. And even your average collector submits a few cards to grade every so often.
The way it used to work is that if you were good at grading - if you could accurately predict what your PSA grade would be - buying raw cards to grade was almost free money. Even if you weren’t good at it - which most people aren’t - the grading fees were so low and turnaround so quick that you could afford to go 1 for 20 and still come out ahead. But with the grading companies shut down pretty much everyone has less money to burn. And all it takes is just a little less free cash flow to cause someone to make just one less bid on an auction. The cumulative effect of all the hobby shops, all the group subbers, all the dealers and all the collectors all making just one less bid . . . well, that can have a very serious ripple effect.
Let me give you a personal example:
32. I had pretty good luck, hitting two Zion Silver 10s, one Ja Silver 10, one Ja Silver 9, and one Ja Red Prizm /299 10, plus a few other good parallels – although no monsters
All-in-all it was a decent return. I didn’t cover the cost of the wax, but I earned most of it back, and had a blast ripping packs. If every years’ Prizm wax experience goes like this, I’d be a happy man because - and this is the key - that $41K went back into cards!
And therein lies the big difference this year:
In 2020 I bought two cases of Prizm Hobby Basketball. I pre-paid, $23K each, on March 25. I overpaid, actually. On March 30, PSA shut off grading. On April 5, the cases were delivered to me. On April 5 and 30 seconds I ripped a case. And then . . . well, that’s it. I’m still in the exact same place I was at on April 5 and 30 seconds.
I haven’t ripped any more wax.
I haven’t submitted any more cards for grading.
I haven’t sold any more cards.
And I haven’t converted any of those cards into cash to be used to buy more cards.
I also watched the value of my remaining case go down considerably; today boxes go for $1200 on eBay. One potential reason 2020 Prizm wax is down almost 40% is because no one can grade-flip the cards they’ll pull. Basically, demand is down on wax (and raw cards) because they can’t be graded. This is a different, albeit related, reason why the grading shutdown contributed to the market dip.
So to recap our primary point, if everyone who bought (or would’ve bought) 2020 Prizm Basketball (or any wax product post March 30, 2020) had just a few less cards to flip, that’s a few less dollars to spend, and if that led to just one less bid on one auction for each person . . . you get it. It’s such an important point that I’m writing it again.
33. By comparison, the indirect consequences of ‘Shutdown’, the Season 5 episode of The West Wing, is that John Wells assured us that everything would be just fine without Aaron Sorkin
Confidence is a critical component of every market and it’s possible that the suspension of PSA and BGS undermined that confidence in our market. Historically, the number one cause of financial panic comes from banks closing their doors. Even a perfectly solvent bank, if unable to meet depositor demand, can trigger a crisis of confidence by refusing to open. The fact that PSA and BGS couldn’t handle the stress of a growing market and suspended grading services - maybe this sent a troubling signal, particularly to new participants. Maybe they’re questioning the vitality and infrastructure of the Hobby at large. Maybe they're worried about whether there will still be ‘free money’ in the system when grading re-opens. Maybe they’re just worried about when grading will re-open. No matter the reason, even a small reduction of confidence can send prices spiraling downwards. Again, if each person makes one less bid on one less auction…
***
Far from being mutually exclusive, all three C’s - card shows, crypto buyers, and card grading shutdown - worked together to cause the Q2 correction and magnify its size. But, and this is critically important: none of them point towards any larger market crisis or fundamental dysfunction. Indeed, in many important ways, they are all a reflection of market health: the proliferation of card shows, the influx of new (albeit jittery) buyers, the grading shutdown caused by extreme demand for graded cards - these are all good things. Rejoice!
***
We can argue whether this extreme volatility is positive, negative or other, but it’s important to realize that price movements aren’t the only thing that matters in the market. The last three quarters brought an extraordinary amount of industry change and, with it, several profound indications of overall market health.
34. If you know of other events which should be captured here, please email us at whitepaper@zerocool.com. We’ll gladly update the timeline in the hopes of eventually deleting the word ‘non-exhaustive’. Or maybe just ‘non’
February:
2/16/21: Goldin Auctions raised $40M from The Chernin Group and a litany of other high-profile investors, including Mark Cuban, Mark Wahlberg and Bill Simmons
2/22/21: The sale of Collectors Universe, the parent company of Professional Sports Authenticator (PSA), was finalized and sold to a group of investors led by Steve Cohen and Nat Turner for ~$850M, resulting in them becoming a private entity
March:
3/2/21: Shortly after the completion of the sale, PSA (the industry’s leading grading company) announced significant price increases
3/30/21: Notwithstanding price increases, PSA was so overwhelmed with submissions that it decided to halt the majority of it’s services. It was rumored that the backlog had reached 15 million cards, or 18 months
April:
4/6/21: Topps, maker of Major League Baseball cards since 1952, announced that they were going public through a SPAC merger with Mudrick Capital Acquisition Corp II. The deal values the combined company (which includes a candy business) at $1.3 billion
4/21/21: Even though PSA has still not reopened its full grading services at this point – presumably still working through the backlog – they were active in the market. They acquired Genamint, an AI-grading company, along with rumors that they are in discussions to buy at least one of their grading company competitors
May:
5/7/21: Retail card locations like Target and Wal-Mart had been dealing with extreme demand for a while at this point, trying many ways to create an equitable distribution system for card products that sell for significantly less than market value. The chaos reached a new high (or low) when a violent fight erupted, involving a gun, over retail trading cards at a Target in Brookfield, WI
5/14/21: A week later, Target decided to halt the sale of trading cards nationwide in its stores amid safety concerns
June:
6/7/21: BGS, the second largest grading company, halted most of their services. Like PSA, they were overwhelmed by submissions and as of the writing of this paper, have not announced when they might reopen
July:
7/1/21: Blackstone acquired CCG, the leading comic book grading company which had recently expanded into card grading
7/1/21: PSA continued an aggressive roll-up strategy by acquiring Goldin Auctions (the leading trading card auction house)
7/6/21: A new record was set for most expensive trading card card ever, as the Stephen Curry 2009 National Treasures 1/1 Logoman Rookie Auto sold for $5.9M
7/14/21: Just two weeks after acquiring Goldin Auctions, PSA then acquired WATA (the leading video game grading company)
7/14/21: It was rumored that Panini (leading producer of NBA and NFL cards), Beckett (parent company of Beckett Grading Services, the number two grading company in the industry), SGC (the number three grading company) and Blowout Cards (the leading hobby distributor) have all engaged in M&A talks with legitimate buyers
7/26/21: Goldin Auctions launched a vault service and announced plans to launch a marketplace platform. Ken Goldin stated that sales had grown 800% in 1H’21 as compared to 1H’20
7/28/21: The record for the most expensive football trading card sale was broken when the Patrick Mahomes 2017 National Treasures 1/1 NFL Shield Rookie Auto sold for $4.3M
- 7/28/21 - 8/1/21: The National Sports Collectors Convention, the largest and most anticipated card show of the year, took place in Chicago during the last week of July. Various reports put attendance at between 100,000 to 150,000 attendees, which would be more than 4x the attendance in 2019 (there was no show in 2020 due to COVID). I was there in both 2019 and 2021 and can confirm that the energy was at a completely different level this time around. My guess is that the average age in the room was 25+ years younger than it was in 2019. ESPN reported that over 46% of attendees were first-timers. 35
-
35. Almost without exception, every person I know who attended the show – including both industry veterans and newbies – expressed the same sentiment as me: I expected it to be amazing, but the show still far exceeded my expectations
August:
In addition to The National, card shows are back in full force! After a complete halt to shows during COVID, we saw a handful of small shows towards the end of 2020; three large (multi-day; 100+ dealer) shows in Q1 2021; and finally a (somewhat) return to normal with eight large shows in Q2 and four large shows in Q3. Meanwhile, smaller shows are coming back as well: ~15 in Q1, 25+ in Q2, and another 20+ Q3
8/16/21: The T206 Honus Wagner once again took the title for the most expensive trading card ever sold, when an SGC 3 sold for $6.6M at Heritage auction
8/17/21: eBay made an historically baller move (my words, not theirs), booting its top card seller (PWCC) off the platform for alleged shill bidding in the wake of PWCC’s not-so-well-kept secret that it was building an auction site of its own. Even more historic, though, was eBay’s card sales during the first half of 2021 (more on this below)
September:
September 2021: Fanatics, the leading apparel licensee for the major sports leagues, and operator of their official websites, including mlbshop.com, nflshop.com and store.nba.com, announced that they had acquired exclusive licenses for the NBA, NBPA, NFLPA, MLBPA and MLB to make their trading cards once the current licenses expire (sometime between 2023-25). The new entity, Fanatics Trading Cards, raised a $350M series A from leading private equity investors Silver Lake, Insight and Endeavor at a $10.4B valuation. They also announced a certain former StockX CEO as co-founder and Chief Vision Officer of the business
By just about any standard for any industry, that’s a lot of action! But as I teased above, perhaps the most noteworthy is eBay’s sports card sales volumes. In Q1, eBay reported selling $871M of sports cards and then, in Q2, when prices seemed to be in freefall, sales actually grew by an astonishing 30% to $1.13B. That’s right: even though prices were headed sharply downwards, and IRL card shows were siphoning money away from online auctions, the volume of secondary market trades for sports cards on eBay surged, cracking a billion in a single quarter.
There’s one more stat I want to restate: 46% of attendees at The National were first-timers, with the average attendee about 25 years younger than two years prior. Remember that Dave Jameison quote about the 1990s, and how the average card collector aged by 25 years? Well, if aging-up is a reliable indicator of a card market crisis, then aging-down (which is clearly happening now) has got to be one of the best signs of market health. Twenty-five years after the ‘90s market collapse and the kids are finally coming home to the Hobby! In my mind, that’s much better news than anything price related.
Part III: What Inning Are We In Now? (Prices, People and Companies)
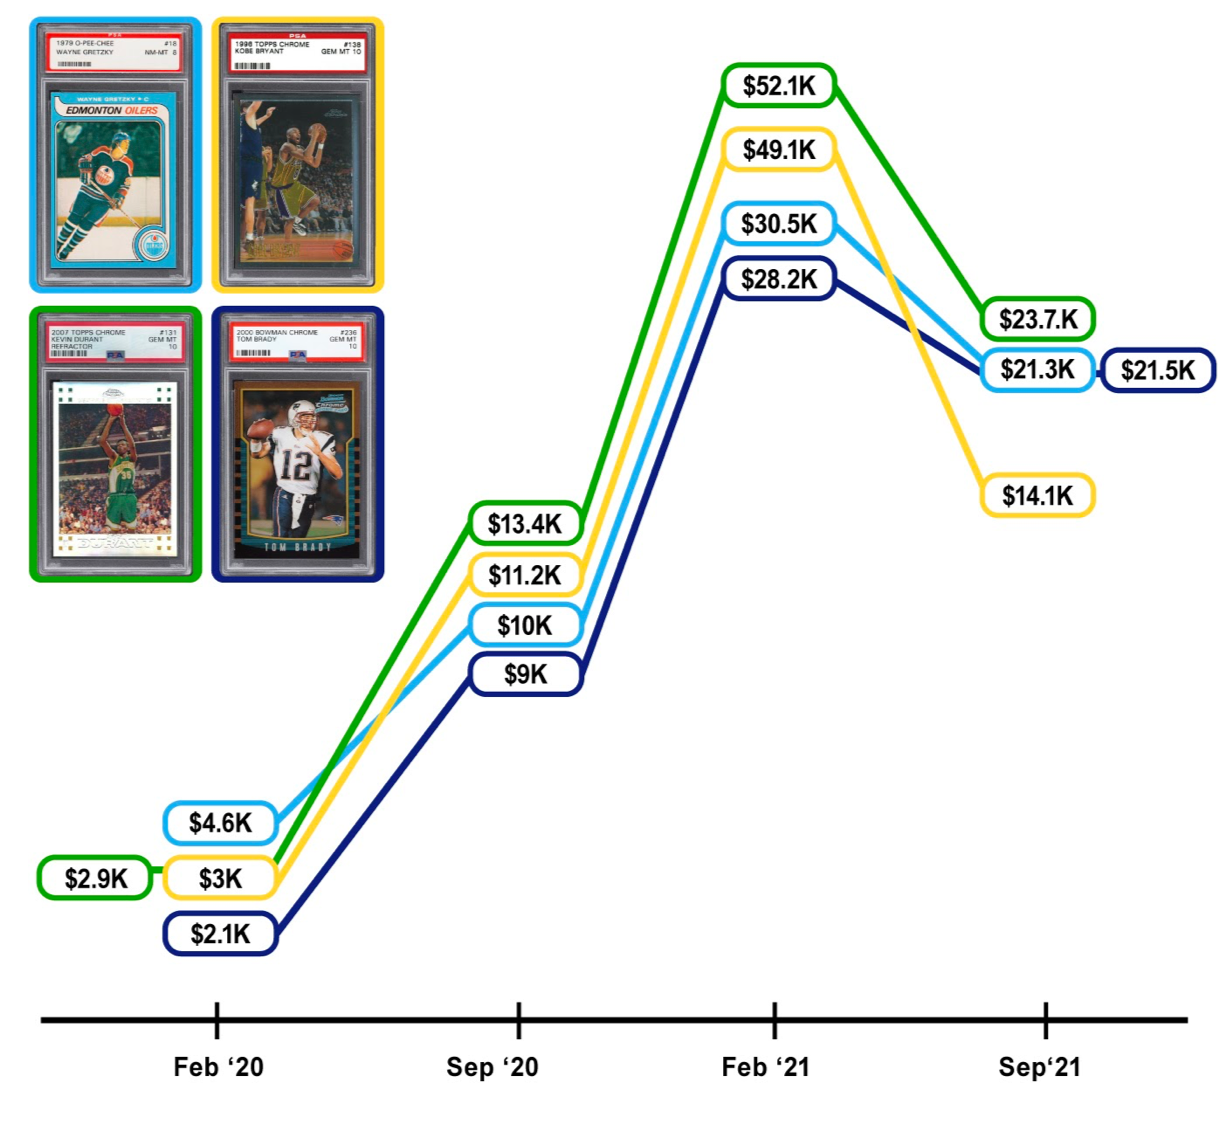
For a long time people have been saying we are in the ‘second inning’ of the card market, but based on what we’ve seen in terms of price movement over the past year, that’s clearly no longer the case. In fact. I think the concept of ‘innings’ is a flawed framework. When talking about the growth of the card market, it’s not a single holistic entity of which all parts move in unison. Rather, I believe there are three distinct parts: PRICES, PEOPLE, and COMPANIES. And each is in a different phase inning.
When we look back at the current iteration of the card market - this pure hybrid of consumer good and financial asset – history will likely point to the post-COVID spike in mid-2020 and conflate the macro factors which helped e-commerce in general (people at home with little to do; stimulus checks) with the reasons for the card market explosion . . . and that will be wrong. The card market was going to explode in 2020 anyway. The seeds of that growth had been sown years prior. However, it is true that those macro factors – the same macro factors which also caused crypto and other collectibles to explode in January / February 2021 – put card PRICES on a much steeper escalation path than the rest of the market (PEOPLE and COMPANIES).
And so, PRICES are clearly beyond the second inning. When LeBron’s core rookie card (2003 Topps Chrome PSA 10) was still at $1500 two years ago, that was maybe the ‘second inning’. But since then it’s gone from $1500 to $50K and back down to $17K (see earlier chart). I still believe this card has considerable room for long-term growth, but the fact that a card with a population over 2,100 – which is a lot in the card world, but tiny compared to the number of people who might want to own a LeBron rookie – has jumped 10x in a year means that pricing is outpacing where we thought it would be. In my opinion, PRICES are in the 5th or 6th inning: there is still room for growth but it can’t possibly continue at the same rate we’ve seen the past two years.
PEOPLE, on the other hand, are not nearly as far along as pricing. Notwithstanding the incredible explosion of cards over the past two years, the net new people in the industry is actually pretty small. Overall awareness of the card market is still low and while it is definitely infiltrating culture (see e.g., Steve Aoki, Mark Wahlberg, Justin Bieber, and most recently Joe Rogan) it is doing so more slowly than it was 18 months ago. In my opinion, PEOPLE are in the 3rd or 4th inning. We’ve had some new people show up, but there are a whole lot more yet to come!
For PEOPLE, this feels very much like sneakers in 2014-2015 when sneakers were slowly becoming more ingrained in culture. People were starting to become aware of rare and expensive sneakers, but hadn’t actually started buying at scale. Of course, we didn’t launch StockX - which made it easy for people to buy sneakers - until 2016; and StockX didn’t really take off until the end of 2017. (We’ll dig into this more in the final section of the paper).
It’s worth noting that there is nothing like StockX for the card industry yet; none of the companies have been able to exponentially improve ease of access to both buy and sell cards, which is the key to opening the floodgates for new people. As more people learn about the booming card market – this August 16 ESPN article is a great overview – it primes the pump for someone to improve access.
And that leads us to the final part of the industry: COMPANIES.
36. Same invitation as with the Timeline to email us updates if you know of other new companies in the space. Send to whitepaper@zerocool.com
Marketplaces: StarStock, Alt, Dibbs, WhatNot plus StockX added cards
Manufacturers: Fanatics Trading Cards, Wild Card, True Creator, Fascinating, GAS, MSCHF and I’m sure plenty more I don’t know about
Price Guide, Analytics and Data: Card Ladder, Sports Card Investor, Alt, SlabStox, Gemrate
Fractional Marketplaces: Collectable, Rally, Otis, Dibbs
Grading Companies: Genamint, Cardscore, CGC, HGA, RCG and the rebirth of ISA
Breaking startup Loupe, breaking leaders like Phil’s Pulls and hundreds of other breakers
Hobby shop franchisor Cards & Coffee plus dozens of new hobby shops
NFT / Card Hybrids like NBA Top Shot and SoRare and the newly contemplated NFL equivalent and whatever NBA Flex is
Countless new IG accounts, YouTube channels, podcasts and other content creators
And those are just the new players.
The established players – like eBay, auction houses, card manufacturers, distributors and top grading companies – also experienced massive growth, but largely through circumstance; they were in the right place at the right time. And like any company that has hyper growth thrust upon it, they’ve struggled to keep up: manufacturers have pushed back releases; printers have struggled to find capacity; Goldin has stumbled through site crashes; and PSA and BGS literally shut down.
But these are all GOOD things!
It means there is opportunity; a ton of low-hanging fruit, at that.
COMPANIES are in the 2nd or 3rd inning. They’re just getting started.
These companies have the resources, talent, and desire to seize the moment and create extraordinary value for both themselves and the industry at large.
And so does the one that I co-founded.
To be clear, this paper is definitely not an introduction or roadmap or manifesto or any type of explanatory document for the work that we will do at Fanatics Trading Cards. Sorry to disappoint, but this is actually the exact opposite. I started writing this months ago. It is my objective view of the industry, in the abstract, almost all of which was written before I’d spent even one minute in the driver’s seat.
That said, I want to reiterate one point that Fanatics CEO Michael Rubin said, which is that our goal is to not only to evolve manufacturing, but also to help improve the customer experience. Exactly how we do that, and with whom, is all TBD, but the important takeaway is that the only way forward for any company in the Hobby is to work together. From printers and manufacturers, to distributors, retailers, hobby shops, breakers, subbers, graders, vaulters, apps, marketplaces, buyers, sellers, investors, and, most importantly, collectors (plus those that I missed), it’s all one ecosystem.
To take the analogy to its natural conclusion, we really are all on the same team, but the reason we are in different innings is because COMPANIES can't move as fast as PEOPLE who can’t move as fast as PRICES . . . but when the companies finally catch up, we all benefit (and do so at exponential rates).
37. For the handful of smartasses out there who will inevitably point out the flaws with using a baseball analogy to begin with - no, I’m not saying that prices will stop going up forever once we reach the ‘9th inning’ - the point is the relative progress of the three parts. Either that or convert the whole thing to a bocce analogy and publish your own 50-page white paper
38. I think it goes: Cards are the Pallino, Prices the Bocce, People the Punto, and Companies the Raffa
So what happens when all these new companies start hitting their stride and catch up?
History gives us several examples of when Prices, People, and Companies align and the incredible bull markets that result. Consider just two examples: the 1990s stock market and the 1980s card market.
39. See Vicki Bogan’s Stock Market Participation and the Internet (2008)
A similar alignment of people, companies, and prices occurred in the trading card market during the 1980s. We talked a lot in this paper about what happened in the 1990s, and how important it is to avoid those same mistakes. But it’s important to remember just how promising things looked during the 1980s, and how the industry was poised for long-term success.
40. And to a much lesser degree, Sportflics and Classic
41. Card Sharks (pg. 137)
What’s happening now with trading cards looks very similar to what we saw in the early-80s card market and the early-90s stock market. Investment in startups, new capital in existing companies, new systems and infrastructure, all enabling new people to enter the market and drive up prices. This in turn inspires more investment, more startups, more people - a virtuous flywheel effect which, when all factors align, can propel the Hobby forward for years to come.
***
More important than where we’re at as a concept, though, is how the progress we’ve made to date prepares us for the future. This is how we address the central question at the heart of this paper: Are cards here to stay, or is this the beginning of the end?
The answer to this question isn’t about the reasons for the runup or the crash, or whether prices will continue rising again (they will - they already are). Rather, the answer to this question depends on the choices we make going forward. More specifically, it’s about how the companies and key stakeholders who constitute the Hobby understand history and navigate change.
To take that next leap forward, we should heed Marshall Goldsmith that “what got you here won’t get you there.”
Part IV: Risk Factors, Warning Signs, and How to Think About the Future
Right now everyone in the Hobby should be thinking about how to evolve, about how to do things differently. Particularly for the companies, we need a new paradigm. Not just in order to scale the industry and make it as big as it can be, but also to avoid the pitfalls of the past.
Part of this paradigm shift will be about technology. There are already positive signs that important stakeholders are investing in tech (PSA buying Genamint is but one prominent example). But technology alone isn’t enough. We also need a new understanding of how it all fits together.
This is especially true for the manufacturers. With few exceptions, card makers have always concerned themselves exclusively with the primary market: how to sell cards to distributors and retailers, and how to sell as many as possible. But this singular focus is unsustainable. Trading cards, like sneakers, are part of that unique class of products where secondary market trading and investment is no less important than primary market consumption - products for which retail and resale are inseparably linked.
This has long been an obsession of mine, even before we founded StockX. And while my assessment of the trading card industry at TED in 2015 didn’t exactly prove prescient (oh the magic of screenshots and close captioning) . . .
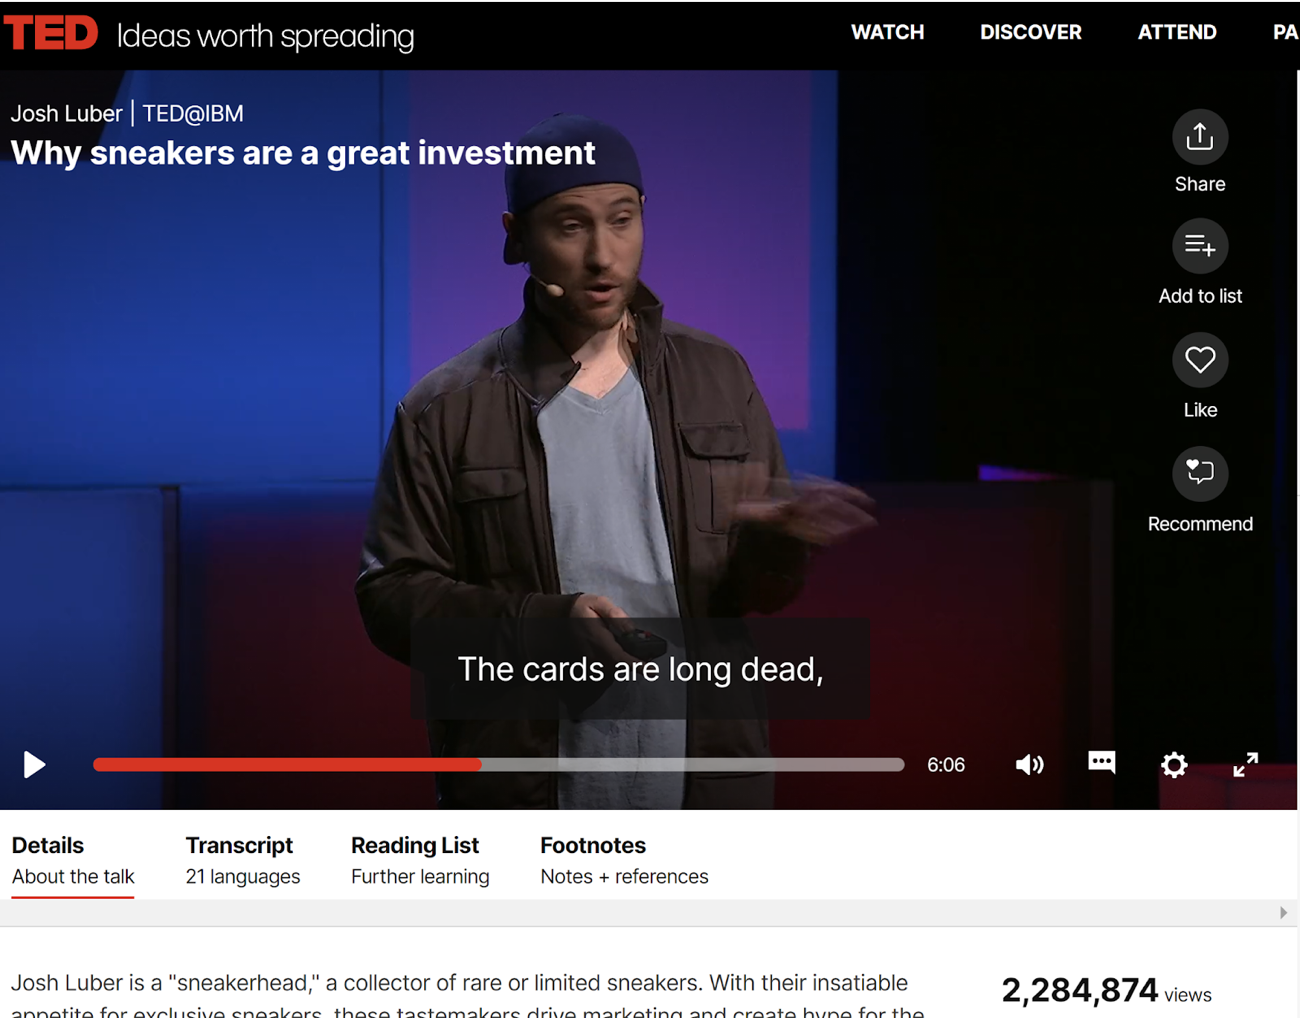
. . . the rest of my early thinking has been proven out much better, and the success of StockX sorta confirms it.
Of course, what’s good for StockX isn’t necessarily good for card manufacturers. But when you look at the main risk facing the hobby today - overproduction and inflation - it’s really about the unsteady balance between retail and resale. And as I argue below, the only way to avoid the consequences of inflation is to think about the problem differently.
42. I don’t have another The Departed reference to make here but if you’ve read this far I promise this paper ends much differently than the movie
Section 1 outlines the central paradox facing every manufacturer: increasing supply to meet demand risks undermining ROI and killing demand
Section 2 shows how the increased production of not just cards and sets, but also chase cards can lead to inflation
And Section 3 shows how sneaker and streetwear companies have navigated these same risks - some successfully, others less so
1 - The Paradox of Supply:
43. A recent report published by Research And Markets estimates that the global trading card market will grow 13x, from $4.7B in 2019 to $62B in 2027
This seems to reinforce our earlier equation:
DEMAND >>>>>>>>> SUPPLY
And so if demand is that much greater than supply then there must be plenty of room to print more wax, right?
Well, maybe not.
When deciding how much to ramp up production, manufacturers face a conundrum: if they increase supply too much, they might undermine the very demand it is meant to meet. To understand how this plays out in concrete terms, consider the logic of opening packs of cards and the role that ROI plays.
44. It’s worth drawing a distinction between “expected ROI” and “typical ROI”. Expected ROI is a mathematical formula that incorporates the very small chance of pulling very expensive chase cards. If we had the data and the time we could calculate expected ROI. Typical ROI, on the other hand, is a term that I just made up as shorthand for the ROI you are actually likely to get with 99% of rips. Expected ROI is like the statistical mean; typical ROI is like the statistical median. In this discussion I’m mostly interested in typical ROI
2018 Prizm is an extreme example but just about all unopened product follows this same basic formula:
45. How negative ROI is varies by product and sport and year, but we all know the universal truth. If you think for a second you’ve found the golden rip, boy do I have a box of rocks to sell you. Or, better yet, an NFT of a box of rocks
Even for ‘retail’ products, where the delta between cost and return may be nominal, typical ROI is still likely negative.
So why do people continue to buy wax? Why would anyone buy 2018 Prizm if you’re likely to lose $4500?
I can think of at least three reasons, each connected to a different form of chance.
First, there’s a chance you might get lucky. You might get lucky and hit a cool card. Or you can get very, very lucky and hit a valuable card. So there’s a “powerball lottery” factor - the chance of pulling a card that’s worth a ton right now.
Second, there’s the chance that your cards will appreciate over time. “Hey, maybe the cards I pulled aren’t worth $5K now, but given what the CL50 has been doing lately, maybe they will be worth more down the road”.
46. There is a subtle but important difference between the appreciation concept versus the emergence concept. In the latter scenario, the only reason you even have rookie cards of this breakout star is because they were in the same packs that you were opening trying to hit other stars, and you kept the worthless (at the time) cards. This exact scenario happened with 2018 football. Josh Allen rookie cards were largely ignored in favor of Saquon Barkley, Baker Mayfield and Lamar Jackson during the first year following release. But two seasons later Allen emerged as a perennial MVP candidate and now his cards are the most valuable in the class
Of course, these aren’t the only reasons we buy wax. There is also value - immeasurable value - in the experience itself. The value of that experience varies person to person, based on that person’s love of cards and love of chance. But everyone who buys wax does so, at least in part, for the experience. And this experiential dimension is what separates trading cards from the more cold and calculating methods of gaming and investment.
47. I should be a research subject for every Harvard white paper analyzing how scent, emotion and memory are intertwined
48. If it grades a PSA 10
49. Some comps: The Luka 2018 Prizm Gold /10 sold for $780K at Goldin and the Luka National Treasures 1/1 sold for $4.6 MILLION back in March. The Black Prizm 1/1 would almost certainly sell for between these two numbers and, in my opinion, would be closer to the $4.6M NT
And the “emergence” chance - that has its own unique experience. That feeling of clawing back through your old box of commons that’s been sitting in your basement for two years hoping to find a few rookies of that new QB who’s on fire. And if you find a rare parallel of that player?! You could have a thousand dollar card sitting next to half-full paint buckets left by the previous owner.
So there are different forms of chance, and different experiences of chance, and together these form the rationale for buying wax. For the sake of simplicity, or maybe just because we like formulas, we can distill this down to a formula:
Actual ROI = Actual Value of Cards Pulled + Appreciation + Expected Value of Player Emergence Over Time + Experience
This is, of course, different from the fact that typical ROI is negative.
Typical ROI is always negative but how negative still matters. If the size of the difference grows too large - or the promise of future appreciation seems too remote - then people will stop buying wax. Insofar as wax is the lifeblood of the Hobby, the potential for our industry’s macro growth is inextricably tied up in this very tricky problem. So it’s pretty damn important we all get it right.
At first glance, manufacturers appear to have two options for keeping negative ROI in check: either drive down the cost of the box, or drive up expected return. But because trading cards are market-driven products, you can’t actually lower “cost” (i.e., market price) without also decreasing value. Trading cards aren’t CPG products; cards aren’t toothpaste; cards don’t have a ‘retail price’ – even if some carry one for a few moments in time. Ultimately (and usually quite quickly) all wax becomes available at its market price (and only its market price). And so for manufacturers, the ONLY guaranteed way to drive down the market price is to increase supply!
And that has a TON of issues . . . which brings us back to the heart of the wax paradox - how do we navigate the Scylla and Charybdis of oversupply and undersupply? How do we crank up production and drive down cost to meet demand without undermining investment value?
2 - Inflation Risks
There are three main strategies manufacturers use to navigate this paradox: 1) Print more total cards; 2) Increase the number of sets; or 3) Mint more chase cards - parallels, memorabilia cards and autograph cards. In each case, they run the same risk: overproduction and inflation.
50. How much easier would it have been to build my desk!
After the ‘90s market crash, card makers learned their lesson. In order to navigate the supply paradox, they began to pursue strategies #2 & #3: make more sets and make more chase cards.
- Sets: Making more sets is a no-brainer. Creating different products for different customers at different price points is a great (and obvious) growth strategy, but there is a natural calendar-imposed ceiling. It’s hard to release more than one set each week 51
-
51. We saw the same thing with the increase of Air Jordan releases as sneakers were becoming more ingrained in culture. Demand was flying but production still peaked around one release per week. This chart is one of my all-time favorite OG Campless pieces of work
and we’ve basically hit that ceiling now. Panini football, for example, has gone from 17 sets in 2012 to 47 in 2020 - and that doesn’t count other, unlicensed brands like Leaf.
- Chase Cards: With sets at it’s natural limit, the focus of manufacturers’ strategy (and innovation) has been around chase cards for quite some time. Chase cards are a subset of unique cards, produced in far fewer quantities than the base cards, where scarcity can be maintained. The three most common chase cards are parallels (a different color or design from the base card), memorabilia cards (putting pieces of a jersey or other memorabilia into the card), and autograph cards (self-explanatory). Some chase cards are numbered - so you know the exact scarcity - and some are not.
Upper Deck introduced the first modern-day autograph chase cards with it’s 1990 Heroes Reggie Jackson sub-set; 2500 were signed by Mr. October, himself. The first true parallels came three years later with Stadium Club’s ‘1st Day Issue’ and the Topps Finest ‘Refractor’. The 1993 Jordan PSA 10 Refractor is worth $15K today; the ’93 Griffey PSA 10 Refractor is $7700. For many years, most sets only had one or maybe two parallels. In 1996 Upper Deck again led the way, this time being the first to put pieces of jerseys in cards. In all cases the strategy was the same - rare, valuable cards you could get lucky and pull from a pack.
As the industry grew – at first slowly, then quickly – the total number of cards being produced grew in turn and so the only way to maintain ROI was to print more chase cards such that the number of hits per box remained the same. In fact, the industry’s global macro policy on supply for decades may simply be a function of a marketing tagline someone put on a box one day (“2 Autos Per Box!”).
52. In a clever bit of statistical engineering, manufacturers have brought back retired players into modern sets, thereby marginally increasing the number of potential “stars”. But retired players are never the main attraction and their number is fixed as well
53. This isn’t meant to imply that there were no sets with more than three parallels between 1993 to 2012, because there were; the point is that in 2012 it was still acceptable to only have three parallels; today three parallels would never fly

You see the exact same trend line for more or less every other product in every sport. Here’s Panini Select Basketball, wherein the number of distinct parallels is up 11x since 2012:

54. Luka Doncic 2018 Panini Prizm PSA 10 has a pop of 17,916 while his Select Concourse PSA 10 has a pop of just 1,621. That’s an 11:1 ratio. Even if you include his Select Premier (654) and Courtside (211) PSA 10s, that’s still 7:1
Here’s one more Panini Select Basketball chart, this time showing the increase in “1/1s” for the overall #1 draft pick. The 1/1 or “One of One” is, by definition, the rarest card there is. If you’re so lucky as to pull one from a pack, that’s amazing! You have the rarest card there is! Or do you?
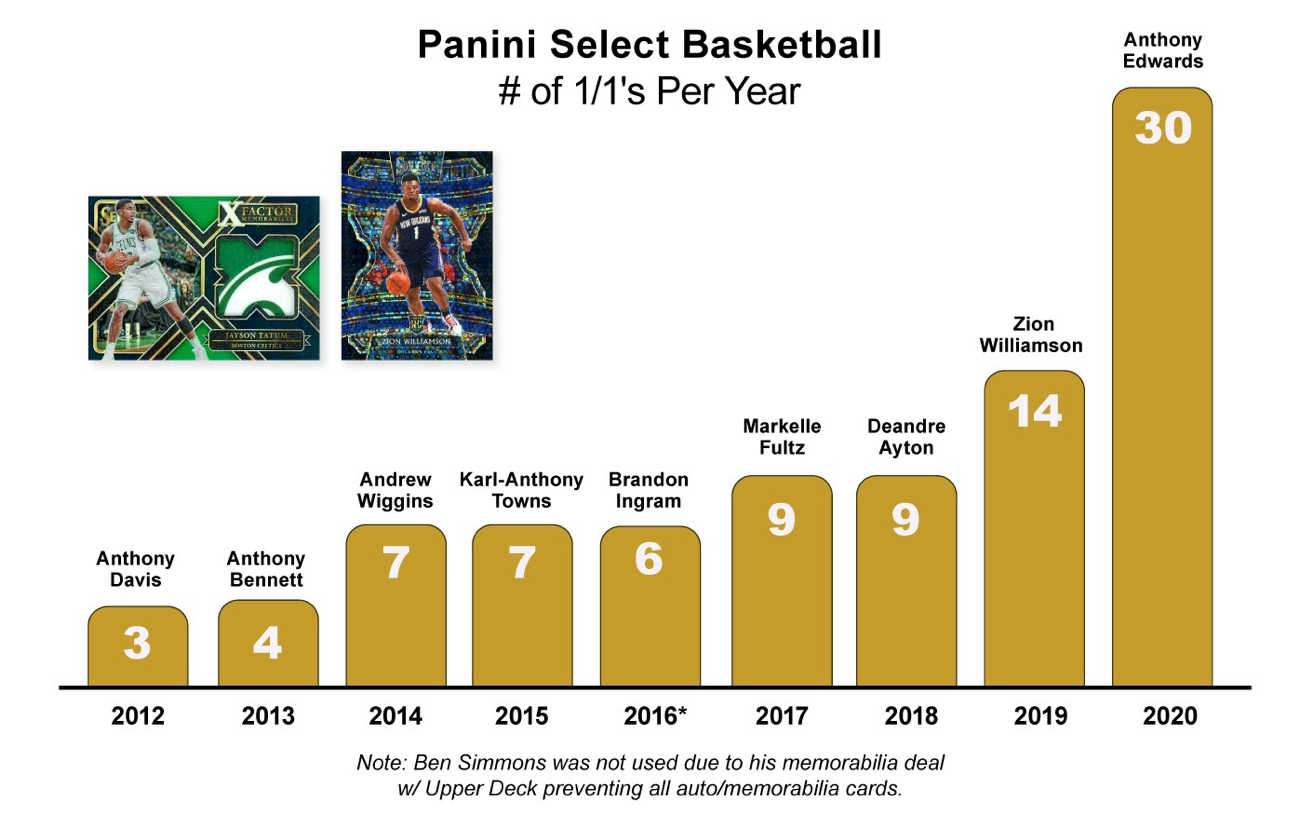
Anthony Edwards had 30 1/1s in Select last year. 30! And that’s just one of 30+ basketball sets that Panini made. And again, notice the jump between 2019 and 2020. More 1:1s were added in the last year (16) than the previous 8 years combined (11).
Manufacturers may hope - and some collectors may believe - that all these different parallels will end up appreciating in the long-term, and that because they’re 1:1s, history will consider them equally great. This assumption - cards that are equally unique and equally scarce should all be equally valued in the long term - might make sense in isolation. But the idea runs afoul of one of the fundamental truths about cards: for any given year, the Hobby will always treat some cards differently than the others (even when the cards are very similar). For example, there’s almost always one version of every rookie card that collectors decide is the best. In 1952, the Topps Mantle rookie became the Mantle rookie, even though Bowman’s version was the first; in 1984, three different companies produced a Don Mattingly rookie but the Donruss version became “the one”. In 1989, the hobby crowned Upper Deck’s Ken Griffey Jr. rookie as the GOAT, even though production was delayed by months and the photo was airbrushed.
So there’s always one card - or a handful of cards - promoted to the top. Those cards become iconic, with a valuation and appreciation befitting Chosen One status. And the others just become . . . others. With each additional rookie, there are diminishing returns, in the same way there are diminishing returns with every chase card.
55. Hopefully we’d at least still have the smell
***
I don’t want to overstate the problem here, nor do I want to imply that increasing supply is ipso facto dangerous. We all know the Hobby is growing, the number of new participants is increasing, and the aggregate demand for cards has gone way up. So maybe it’s OK that the number of cards (and chase cards and sets) has also gone up. After all, it’s just keeping pace with a rapidly expanding market.
Viewed this way, we may be seeing “inflation” in a technical sense, but not in a negative sense. Like the way governments increase the money supply in order to keep pace with (and indeed fuel) a hot economy. Like we said at the beginning: we’re living in a world where demand is outstripping supply. And so manufacturers have dueling interests tugging at their bootstraps - all the card-loving kids (and grownups) who want the instant gratification of more cards today vs. those same collectors several years from now, wondering where the long-term value of their cards and the long-term health of their industry went.
To be extremely explicit, I am not judging manufacturers or concluding anything about their previous and current supply and demand policies or practice. I am most concerned with identifying and explaining the fundamental risks. Given all these variables, including the Rumsfeldian “known unknowns”, the important thing isn’t that manufacturers get things exactly right, or manage to obtain perfect right information. The important thing is to understand what’s going on, and know what to look for.
3. Lessons from the Sneaker Market: Less Now, More Later
It helps if you’ve spent some time studying the sneaker market.
56. Some call this ‘artificial scarcity’ but that has a negative connotation that isn’t at all accurate (or fair). The reality is that Nike and Supreme understand the value of keeping supply low: indeed, the current world of “hype” fashion only exists because of this reality. So unless you want sneakers and streetwear to become just “shoes and clothes”, you have to accept - even support - a certain degree of scarcity
The logic is pretty simple:
Step 1: Create limited-release products, where demand > supply.
Step 2: Flame the demand imbalance to generate brand heat and hype that comes from kids lining up to buy your t-shirts or causing the latest drop to trend on Twitter.
Step 3: Translate that heat into thousands of new customers and loyalists, such that you can increase supply and capture more profit while still maintaining the scarcity of Step 1.
When done correctly, it’s a beautiful and virtuous cycle - a flywheel effect that deifies certain product, increases the number of people in the market, and a halo effect that trickles down to every other product. (That new sneaker smell of a fresh pair of Jays is something to cherish, as well).
57. Let’s try out the analogy: I say “I wish Panini would put more 1/1s in Select so I can have a better shot of pulling one” but what I really mean is “I hope I hit the base 1/1 and not one of the 29 insert 1/1s”
Nike understands this well and has been a master of managing the paradigm since 1985, when the first Air Jordan's were released. adidas, on the other hand, has a long history of misplaying the hype game, 58
58. The link is to a StockX blog post I wrote in November of 2016 titled ‘The History* of adidas Resell’. I am pretty sure this was the last ridiculously long industry analysis I wrote, prior to this one. I guess what I’m saying is that if you actually read this whole thing, I promise not to do it again until 2026
But adidas went too far and by the end of 2018 the market was saturated. The average price premium for Pharrell NMDs on the secondary market had fallen from 350% to 0%, with some releases trading for less than retail. Having killed all hype, the NMD silhouette itself quickly fell out of fashion, and today hardly anyone talks about NMDs anymore.
The lesson here is this: If you produce too much now, you risk saturating demand too quickly and eroding long-term brand health. Conversely, if you keep production limited now, you increase the chance of creating an on-going brand with strong long-term demand.
In the sneaker industry, the temporal nature of this paradox is instant - it happens for every release - and so it makes the concept very easy to understand. This is what I call the ‘Sneakerhead Demand Theory’:
If demand for a pair of sneakers is 100 and Nike makes 91, they’ll sell 91. Easy
But if demand for that shoe is 100 and Nike makes 101 . . . they might only sell 70 or 60 or some number WAY below 91
The reason this happens is because as long as supply is less than demand then the product is scarce, it’s cool, and it’s worth more than the retail price
And so the people who will try to buy the shoe include both people who want to own it PLUS people who want to take advantage of the arbitrage. After all, who wouldn’t buy a $100 widget that’s being sold for $50?
But as soon as supply exceeds demand the product is no longer scarce, it’s no longer cool, and it’s no longer worth more than it’s being sold for - and so the only people who buy it are just those who want to own it
Here’s what it looks like in action, Sneakerhead Demand vs. Actual Demand:

The logic is simple then, right? Just create less than demand. In practice it’s not so simple. First, demand is not an exact science. How can any company, even Nike, know exactly how many people will want to buy a pair of sneakers? But even more complicated is that they have to figure out two different, but circularly-related demand numbers: the owners and the flippers. It’s very easy to be very wrong - we saw it play out with the adidas NMD.
59. Sneaker values also change over time, but not nearly as much as cards. Sneaker values follow a very predictable time/demand curve
60. Even if they were to somehow align on such a strategy, implementing it in the face of 40+ different sets, each with its own group of chase cards, with different rookies and champions each year would be next-level impossible.
It’s MC Escher-inducing, I know, but it’s what we have to be thinking about.
It’s not just about “producing less”, either. There are some interesting strategies that meet demand without increasing total supply, most notably Repacks and Buybacks:
Repacks usually involve buying graded singles and repackaging them in a new product. This technically increases the supply of products consumers can rip, but doesn’t actually increase the total number of cards manufactured. And while repacks are typically done by shops and dealers, there's nothing stopping manufacturers from doing them too.
Buybacks are when a manufacturer buys high-value singles from previous years’ on the open market and includes them in the current year’s wax. Just like with repacks, buybacks have no effect on the total supply of cards, but in this case it increases the number of chase cards a collector can hit. Interestingly, just like corporate stock buybacks, where companies purchase their own stock on public markets as a way of boosting shareholder portfolios, both repacks and buybacks have the benefit of juicing demand (and increasing card values) without risking inflation.
Repacks and Buybacks don’t have any direct corollaries in the sneaker industry, but it reminds us to be creative. Card manufacturers are perfectly poised for long-term success, but they can easily fall victim to short-term shortsightedness. To harness the hype cycle and set in motion the virtuous flywheel of high prices driving new participants, and new participants driving higher prices (and a bigger total market), the goal is decades of Air Jordans, not a few months of NMDs.
Part V: Sneakers, Cards, and the Future
Back in July I wrote an email that was a bit too long explaining why card prices had recently fallen and what it meant for the Hobby. Someone suggested that I share my thoughts. Four months, 50 pages and 60 footnotes later, we are finally returning to the question we asked at the beginning:
Where are we in the historical trajectory of cards?
Are we at the beginning? Or are we nearing the end?
Are cards here to stay?
To come full circle, both for the answer to this question and for me personally, let’s return to our comparison with sneakers.
As we’ve just seen, sneakers provide a useful model for the same thorny supply & demand dynamics that bedevil card manufacturers. But the similarities between cards and sneakers run much deeper than that. Both markets rely on the complex interplay of retail and resale. Both markets are oriented around our cultural obsession with sports, with one athlete in particular - Micheal Jordan - serving as both their lodestars. Both markets are presently fueled by the same generational dynamics - the same children of the 80s and 90s rediscovering their childhood passions, realizing they can now afford those shoes or cards they couldn’t as a kid, and teaching their children to share those same passions. In 2014 I got a dozen emails a week from people asking for help finding Jordans we used to wear in high school. Now those exact same people text about Jordan rookies.
Given all these similarities, if you’re looking to understand the direction that trading cards are headed and the potential for growth, there may not be a more valuable perspective than understanding the past 10 years of sneakers.
***
61. The primary sneaker market, on the other hand, was the pinnacle of consumer advertising and an absolute blast: It’s Gotta Be The Shoes; Mr. Robinson’s Neighborhood; I am Not a Role Model; and so much more
62. Other analysts, like Matt Powell of NPD Group, thought my estimates were wildly exaggerated, and claimed that the secondary market was small and largely irrelevant. Last year, StockX alone did $1.8B in sales, and the company is now valued at nearly $8B, so let me take this opportunity to exercise a years-old Twitter beef against an internet troll I’ve never met and just say: Matt, at least I’m only petty enough to say ‘I told you so’ in the footnotes
63. Data taken from Piper Sandler’s latest survey, Taking Stock With Teens (Fall 2021)
Noticing a pattern here? It’s our familiar virtuous flywheel of Prices, People, and Companies. And the cycle works with sneakers the same way it does with cards. Nike creates a limited product, which becomes coveted and valuable (Prices); this limited, valuable product brings in new customers (People); the increase of new people attracts fresh capital for startups like StockX (Companies), which open the market for new people, who create more value, and on and on it goes.
But sneakers have a little something extra: culture. Much as I’d love to believe otherwise, people don’t wear and collect limited edition sneakers because of StockX; they wear and collect sneakers because sneakers are cool, and they’re cool because culture says they're cool.
So how did that happen? How did sneakers become cool?
Part of it is a “people” story. Those millions of people who discovered (or rediscovered) sneakers in the last 10 years - some of them were celebrities and influencers, and when they started collecting (and paying thousands of dollars for) sneakers, it made the subculture more mainstream. I can’t drive the same car as Jay Z, but I can wear the same Jordans.
64. Of course, now that I’m a father myself and can appreciate how hard it is to be a mother I think my mother (and wife) are both really cool and should be the epicenter of culture. But, alas, that’s why I still listen to the same music I did when I was 19, and 19-year olds don’t dress like Barbara Luber
So that’s how the people who matter end up wearing certain products and kicking off the virtuous flywheel of people, companies and prices we’ve discussed at length . . . BUT (and isn’t there always a ‘but’) . . . that cycle becomes hyper-charged when the people who matter engage with that product as both a consumer and a creator. It’s for that reason that the single most important vector in sneakers’ cultural takeover has been exclusive collaborations.
Through limited collabs, sneakers transcended the narrow world of sports (“just basketball shoes”) and became inextricably tied to every other part of culture. They’ve become part of music (Kanye, Drake, Travis), fashion (Virgil, LV, Supreme), movies (Space Jam, Back To The Future), art (KAWS, Murakami) and everything in between. Through collaboration, sneakers spread like a virus through the culture. See Travis Scott.
Travis Scott is cool. He’s got 43.5 million Instagram followers. After trying on whatever shoes my mother wore today, he decides instead to buy an uber-rare, ultra-exclusive pair of Nike SB Dunks on StockX that was a collab between Nike and Stussy in 2005. Nike sees Travis wearing this $3000 pair of shoes courtside at a Rockets game and decides to give Travis his own SB Dunk collab. Those Dunks are immediately reselling for $2000 and now Travis fans want SB Dunks, too. Kylie Jenner (the mother of Travis’s daughter) starts wearing SB Dunks, whether to support him or because she thinks it’s cool or whatever it doesn’t even matter at this point because she only has 277 million IG followers so guess what SB Dunks matter. Coolness is contagious.
In this case, as it is for all sneaker collabs that reach that Level 10, supersized, extra spicy dose of culture, Travis evolved from being just a consumer of the product to also being a creator.
Cultural icons consuming and creating extremely limited products.
But that wasn’t always the case.
65. Never forget
66. The exact same thing happened with Reebok’s 50 Cent collab (the ‘G Unit’ shoe): oversupply made the sneakers culturally irrelevant. See Nicholas Smith’s book, Kicks, for more details (Kicks, pg. 224)
67. The logic of limited supply was recently detailed in a New York Times lead story - the latest in a series of mainstream media longreads on ‘the crazy sneaker market’ - that centered around a collab between New Balance and Bodega. As a result of Bodega’s effort to crack down on bots and resellers, the Bodega release failed to sell out quickly and was considered a failure - e.g. “uncool”. It’s worth quoting the story at length: “For Bodega, the damage was done. Because of the payment issues, it took 45 minutes for the shoe to sell out completely, which for a major release is an eternity. “If a shoe like this doesn’t sell out in less than 15 minutes, it’s considered a failure,” Mr. Gordon said….The slow sellout time didn’t seem to go unnoticed by the resale market. Even though most of Bodega’s previous New Balance releases carry a significant premium to their retail price, the 15th anniversary shoes are selling at close to retail on StockX.”
***
As I mentioned back in Part III, if you look at the cultural relevance of trading cards right now it looks a lot like sneakers circa 2015. Like sneakers, tastemakers are starting to collect cards as art; next-gen investors are building out card portfolios; and celebrities, musicians, influencers, and other key figures are beginning to flex their collections and validate the Hobby - i.e., Logan Paul wearing a $200K Pokemon card to his fight with Floyd Mayweather Jr.

You even have examples of the same “creator/consumer” model we saw with sneaker collabs, where ultra cool tastemakers - including some of the same figures from the Streetwear Cinematic Universe - create limited card collabs (e.g., Bobby Hundreds and Topps Project 70).
But it’s still early and the numbers are still small. Cards have not achieved anywhere near the level of cultural ubiquity and coolness as present-day sneakers. And the potential for creator/consumer culture collabs is almost entirely untapped.
Similarly, when it comes to innovation and investment (e.g., Companies), it feels like trading cards are also about six years behind sneakers. In the same way that 2015 was a tipping point for sneakers, with a flood of new capital and startups first entering the fray and enabling the true intersection of culture and commerce to flourish, 2021 feels like a tipping point for cards, as evidenced by the long list of companies cataloged in Part III.
And this is all great news. Because if cards are that far behind sneakers - both in terms of People and Companies - it means there’s a lot more room to grow. Today, StockX alone is more than twice as big as the entire resell sneaker market was when we launched the company. And the reason why is because sneakers became truly intertwined in culture. When we started working on StockX in the summer of 2015, Kanye hadn’t made a single shoe with adidas; Virgil was years away from working with Nike; and Travis was barely on the charts, let alone making kicks. Today those three account for more than half of resell sneaker sales. You can’t project that; you can’t model that. That’s the power of culture.
68. Of course, opponents will point out that, despite Logan Paul, you don’t wear cards, so there may be a natural ceiling to how culturally ingrained they can become. That said, the very nature of trading cards is that we collect pictures of culturally relevant people. Also you don’t wear art either, and that seems to have stuck
I’ve been using some version of this diagram in decks for two years now:

The implications of this truth are that every business model, every opportunity, every potential partner, every idea, everything in all four of these industries is on the table for trading cards to adopt and exploit as it evolves as an industry.
Think about that.
There’s a world where the future of trading cards looks like Wall Street.
There’s a world where it’s Vegas.
Or ComplexCon.
Or Amazon.
I hate elevator pitches. So when people used to ask me for a StockX elevator pitch I’d say “You take Amazon and the New York Stock Exchange, put them together, make them bigger, cooler and more efficient.”
It was an intentionally glib response to appease investors who only ever asked about TAM - but I actually genuinely believed it. That was my vision for StockX.
I was wrong though.
You can’t actually reach that scale with sneakers because they aren’t true investable assets. No matter how valuable a pair is, no matter how well you keep it, it’s still just rubber and leather and glue and will eventually deteriorate.
But trading cards…
Trading cards are true investable assets.
Trading cards are a more perfect product for the StockX vision than sneakers ever were.
It just took me a few extra years to realize it.
***
And so now we know the path forward, because we’ve seen it with sneakers in the 2010s, stocks in the 90s, and cards themselves in the 80s. As companies continue to innovate, collaborate, and better understand collectors, it creates access for new people to enter the Hobby.
69. Insert your own Field of Dreams reference here
And by now you know what that means…
The virtuous flywheel continues, driving higher prices when market conditions allow, bringing more business for everyone when the timing is right, and allowing us to reinvest even more into areas that need it. Then we’ll hit the next tipping point, even bigger dollars will flow into cards, boosting investment, prices and profits for all. In short, both cards and card businesses will become more valuable. And just like we thought decades ago, card collecting is here to stay. Not just stay, but prosper.
This time for good.
I can smell it coming.
APPENDIX
Card Ladder’s CL50 Index
The CL50 keeps track of 50 of the most notable and iconic cards with good market liquidity to help give an overall view of how the market is doing. The index consists of an ever-evolving list of 50 cards and are decided by the Card Ladder team based on market reaction and overall collector preference. The math behind it is simple: every day they track the current market value of each card (in their highest grade possible) and aggregate their values. Once aggregated, they divide by the total number of cards (50) to get the daily index value.
The CL50 Index consists of the following cards:
1968 Topps Nolan Ryan & Jerry Koosman #177 (PSA 6)
1996 Topps Chrome Kobe Bryant #138 (PSA 10)
1980 Topps Rickey Henderson #482 (PSA 9)
1955 Topps Roberto Clemente #164 (PSA 6)
1997 Topps Chrome Tim Duncan #115 (PSA 10)
1998 Topps Chrome Peyton Manning #165 (PSA 10)
2001 Upper Deck Tiger Woods #1 (PSA 10)
1989 Upper Deck Ken Griffey Jr. #1 (PSA 10)
2013 Prizm Giannis Antetokounmpo #290 (PSA 10)
1989 Score Barry Sanders #257 (PSA 10)
1984 Topps John Elway #63 (PSA 9)
1961 Fleer Jerry West #43 (PSA 6)
2001 Topps Chrome Traded Albert Pujols #T247 (PSA 10)
1993 SP Foil Derek Jeter #279 (PSA 9)
1972 Topps Julius Erving #195 (PSA 8)
1965 Topps Joe Namath #122 (PSA 6)
1985 Topps Mario Lemieux #9 (PSA 9)
1980 Topps Larry Bird, Magic Johnson, & Julius Erving (PSA 9)
2005 Upper Deck Sidney Crosby #201 (PSA 10)
1963 Topps Pete Rose #537 (PSA 8)
1976 Topps Walter Payton #148 (PSA 9)
1955 Topps Sandy Koufax #123 (PSA 7)
2009 Topps Chrome Stephen Curry #101 /999 (BGS 9.5)
1961 Fleer Oscar Robertson #36 (PSA 6)
2017 Prizm (Silver) Patrick Mahomes II #269 (PSA 10)
1986 Topps Traded Barry Bonds #11T (PSA 10)
1992 Upper Deck Shaquille O'Neal #1 (PSA 10)
1986 Topps Jerry Rice #161 (PSA 9)
1981 Topps Joe Montana #216 (PSA 9)
2011 Topps Update Mike Trout #US175 (PSA 10)
2003 Topps Chrome LeBron James #111 (PSA 10)
2005 Upper Deck Alexander Ovechkin #443 (PSA 10)
2018 Silver Prizm Luka Doncic #280 (PSA 10)
2007 Topps Chrome Kevin Durant #131 (PSA 10)
1986 Fleer Michael Jordan #57 (PSA 9)
1979 O-Pee-Chee Wayne Gretzky #18 (PSA 8)
2000 Bowman Chrome Tom Brady #236 (PSA 10)
1999 Pokemon Game Charizard 1st Edition Holo #4 (PSA 9)
1933 Goudey Babe Ruth #144 (PSA 4)
1954 Topps Hank Aaron #128 (PSA 5)
1948 Leaf Jackie Robinson #79 (PSA 4)
1961 Fleer Wilt Chamberlain #8 (PSA 6)
1966 Topps Bobby Orr #35 (PSA 6)
1957 Topps Bill Russell #77 (PSA 6)
1984 Topps Dan Marino #123 (PSA 10)
1958 Topps Jim Brown #62 (PSA 7)
1998 Topps Chrome Dirk Nowitzki #154 (PSA 10)
1969 Topps Kareem Abdul-Jabbar (Lew Alcindor) #25 (PSA 7)
1952 Topps Mickey Mantle #311 (PSA 4)
1952 Topps Willie Mays #261 (PSA 5)
2. 2018 Prizm Basketball ROI Math
2018 Prizm is an iconic set, both for the actual rookies in it (Luka, Trae, SGA, MPJ, etc.) and because this was the flagship product during the year when so many new people re-entered the Hobby (myself included). The Luka Doncic 2018 Panini Prizm #280 PSA 10 – which pop count is now approaching EIGHTEEN THOUSAND and has got to be one of the five most populous cards in existence – is somehow still selling for $800. It is this generation’s Ken Griffey Jr. 1989 Upper Deck.
I said that the typical ROI on a box of 2018 Prizm is around $500. So how do I arrive at that number? Well, first start with the assumption that you’ll most likely hit one Luka or one Trae Young as your top card. Here’s the breakdown of those cards, their likely grades, and current Card Ladder values:
·Luka PSA 10 $800
·Luka BGS 9.5 $607
·Luka PSA 9 $320
·Trae PSA 10 $260
·Trae BGS 9.5 $177
·Trae PSA 9 $78
My logic here is that if you buy 6 boxes you will end up with one of each of these, so your expected average is $373 per box. Maybe you hit another few rookies and a one or two nice star parallels, so call it $500.
That’s actually the generous way to do it because it assumes you can send in your cards to PSA and BGS (which you can’t) and get them back in a reasonable time (which you won’t).
The more accurate analysis would be to just look at raw values. A Luka raw is $264 and a Trae raw is $54. If you get one of each for every two boxes, then on average your expected value is $159 as your top card in the box. If so, it’s unlikely you’re going to pull another $341 of value out of the box.
So at most the typical ROI on a box is $500, but in reality it’s probably less than that. Yes, people are still buying boxes for $5,000. But it’s hard to imagine the Hobby sustaining itself if the cost-vs-return delta for wax remains that high.
3. Chasing the Tom Brady 2018 Prizm Rainbow and the Theory-of-One-Less-Rich-Guy
I had just made a monster deal for the Tom Brady 2018 Prizm Black Finite 1/1 and then found the Gold Vinyl /5 on Alt, so all I really needed was the Gold /10. I had actually passed on a BGS 9.5 for $23K at The National so I was feeling serious FOMO. And then a BGS 9 came up on eBay. I knew several other people interested in the card so I knew I had to bid big. I bid $78K (which was a MASSIVE gut punch to do after passing on a BGS 9.5 for $23K only two months prior) and won it for $57K.
A few weeks later another Brady 2018 Prizm Gold BGS 9 was listed on eBay. Because I had just paid $57K for one, I decided that I would buy a second one only if I could get it for a good deal, so I bid $44K. But this time I lost, and it sold for $45K. And I’m pretty sure that the person who won the card for $45K was the runner-up bidder from the first auction (when he presumably bid $56K). You see how that works? First auction we both bid our max ($78K; $56K) and I won at $1K greater than the lower bid ($57K). Second auction we both bid our max ($44K; $56K) but now because I own one of these cards, my max goes down (from $78K to $44K). His max stays the same because he still doesn’t have one, so he wins at $1K greater than the lower bid ($45K).
All completely logical and expected but to a casual observer the market price of the Brady 2018 Prizm Gold dropped by 27% (from $57K to $45K) in only two weeks. A few people even tried to call me out on Instagram for I-don’t-even-know-what. I have nothing to hide here and, in fact, it’s a perfect example of how prices move on big cards.
Bibliography
Williams, Pete. (1995). Card Sharks: How Upper Deck Turned A Child’s Hobby Into A High-Stakes, Billion-Dollar Business. Macmillan.
Jamieson, Dave (2010). Mint Condition: How Baseball Cards Became an American Obsession. Atlantic Monthly Press.
Smith, Nicholas. (2018). Kicks. Broadway Books.